Weather Service Launches Interactive Climate Graphs for Mid-South Stations
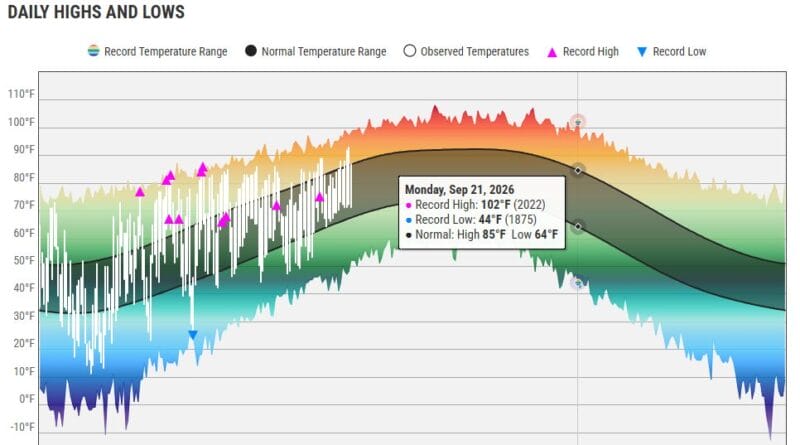
The National Weather Service has launched new interactive climate graphs for numerous reporting stations in the Mid-South, extending beyond Memphis. The graphs allow users to explore temperature and precipitation data with interactive readouts that follow the cursor.
Users can customize their view to focus on a specific month or the past 30 days. The new tool also provides context for last January’s cold snap, helping viewers understand recent weather patterns.
The climate graphs are accessible online at https://www.weather.gov/wrh/climate?wfo=meg&tab=cliplot, offering a more detailed look at regional climate trends for residents and researchers alike.
Source: Original Article